Using An Estimation Grid To Improve User Story Estimation

Estimation is tough.
We all know it and we all struggle with it. Most of the challenge of estimation is due both to the abstract the nature of software as well as the challenge of estimating something’s complexity. In fact, due to the abstract nature of estimating in story points, teams find that their goal is less often accurate or precise estimates, but more often consistent estimates.
Although we often struggle with assigning specific values to items we’re actually quite good at assigning relative values to objects. For example, few of us could glance at a bucket of water and estimate exactly how many ounces that bucket will hold. But, we could easily estimate that the bucket holds more ounces than a glass and less ounces than a swimming pool.
Teams can also apply this same relative estimation technique when estimating a particularly tricky piece of work. However, this is often done by estimating new stories relative to the size of other stories that the team has not yet worked on, such as other stories that have also been selected for the sprint.
While any relative estimation can be helpful, it can be more helpful to compare new stories to stories that have already been delivered and that the entire team agrees were estimated correctly.
Meet the estimation grid
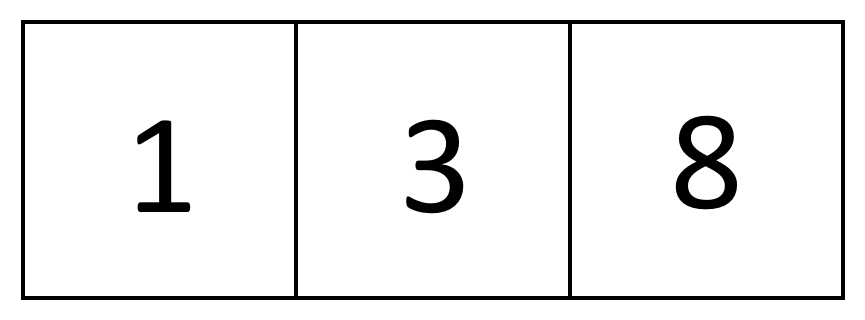
One of the most powerful ways to do this is with the use of a tool called an estimation grid, which is simply a grid containing a cell for every other number in your team’s estimation range.
For example, if your team estimates using the values in the Fibonacci sequence from 0 to 13 then your estimation grid would look like this.
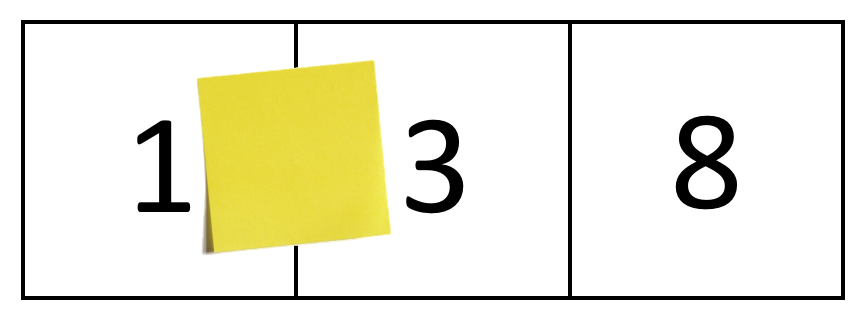
In each cell, place a sticky note representing a story that your team has recently completed that everyone agrees was indicative of its original estimate. For example, if in the last sprint your team completed a story that was originally estimated at 3 points, and everyone still agrees with that estimate, then place it in the cell for 3.
Putting the estimation grid to work
Once the grid is built you can begin working through your estimation routine as normal, such as by playing a few rounds of Planning Poker. However, once your team gets stuck on a particularly tricky story then it’s time to refer to the grid.
For example, imagine that your team is trying to estimate a story to add support for a new payment gateway to your ecommerce app. While the act of supporting the new gateway seems straightforward, it will involve touching a particularly complex piece of the codebase. For this reason, many of the team are unsure of how to estimate this story.
But by comparing this story to the reference stories already found on the estimation grid, your team is able to spot key similarities between this story and the reference 3 point story, such as a relatively straightforward set of business rules coupled with a complex area of the codebase. As a result, the team estimates this story as a 3.

Later, when the team finds themselves stuck on another story to add a simple CSV export to an existing report they return to the estimation grid. However, this time the answer is not as straightforward. While they find that adding this export seems more complex than the reference 1 point story, it’s not quite as complex as the reference 3 point story. But since the complexity of the story seems to fit neatly between these two reference stories your team assigns the story an estimate of 2.
Getting the most out of your estimation grid
While the estimation grid is already a powerful tool, there are a few things that you can do to get even more out of this tool.
First, resist the urge to use the estimation grid for every story that your team encounters. You’ll still want your team to be able to evaluate the complexity of each story through discussion and shared discovery rather than simply defaulting to comparing every story to the same handful of stories. Your estimation grid should be an aide, not a crutch, so only refer to it when needed.
Next, be prepared to update your estimation grid periodically. As the work your team is doing evolves they’re likely to begin working with different technology stacks, in different areas of the codebase, or with different themes of your product. Occasionally checking that your reference stories reflect these changes and replacing those that do not will help keep your reference stories relevant to your team’s needs.
Finally, resist the urge to create a cell for every value in your team’s estimation range. For example, you may have wondered why we didn’t create a cell for each value in the Fibonacci sequence from 0 to 13. There are two reasons for this. First, finding a canonical reference story for each value in that range can become tiresome, especially for those values that your team rarely uses. But second, and most importantly, you don’t want to paralyze your team with too many choices.
Generally, speaking humans make decisions easier when presented with fewer choices. For more on this, you can check out this article from Harvard Business Review, but for our purposes simply know that presenting your team with more choices to compare a tricky story to is likely to make act of the estimation longer rather than shorter. Instead, keeping your estimation grid simple and only giving your team just enough options will help keep the entire estimation process as painless as possible.
Wrapping up the session
Once your planning session is complete, a great way to wrap up is by laying all of your team’s estimated stories over your estimation grid and looking for patterns or clusters. For example, did it seem as if your team estimated the majority of their stories at the high end of your range? Larger stories are more complex and, as a result, tend to be less well understood. While a single large story in a sprint is unlikely to be a cause for a concern a sprint that’s primarily comprised of large stories is likely to be a very risky endeavor.
Or does your sprint seem to have many 0 point stories? While some stories may be so simple as to feel as if they do not warrant a point, no story is truly free. Every story takes time and attention from your team to deliver. While a few 0 point stories may not be cause for concern, many 0 point stories can add up and threaten your team’s chances of delivering everything they’ve planned for the sprint.
While the right answer is going to vary for every team, generally speaking I like to see most of a team’s stories clustered in the lower end of their estimation range. Stories this size tend to be just large enough that you can understand the impact that each story will have on our team’s velocity but are not so large to contain large amounts of unknown.

If your team’s sprint doesn’t seem to be clustered as I just described then don’t panic, you can simply take some of your larger stories and try to split them into smaller stories to reduce your risk. And if your team gets stuck estimating some of those newer stories then now you have a tool to help them.